Introduction
Ask how reliable a data center is, and the answer usually comes back as an uptime rating for a single building. Industry benchmarks give two of the common tiers very different numbers:
- Tier I: a data center with no backup generator or duplicate power and cooling systems, rated at roughly 29 hours of downtime a year.
- Tier III: a data center with redundant power and cooling, rated at roughly 1.6 hours of downtime a year.
What a Building’s Rating Leaves Out
The difference between the two ratings looks large. A business running AI applications, known in the industry as a tenant, is asking a more practical question, though: will its AI service keep answering users when equipment fails or a site goes offline? That service runs on AI inference, the work an AI model does each time it responds to a request. A tier rating describes how well one building’s power and cooling are built to stay online, so it can only answer the tenant’s question when all of the tenant’s capacity sits inside that one building.
Building the Backup Into the Network
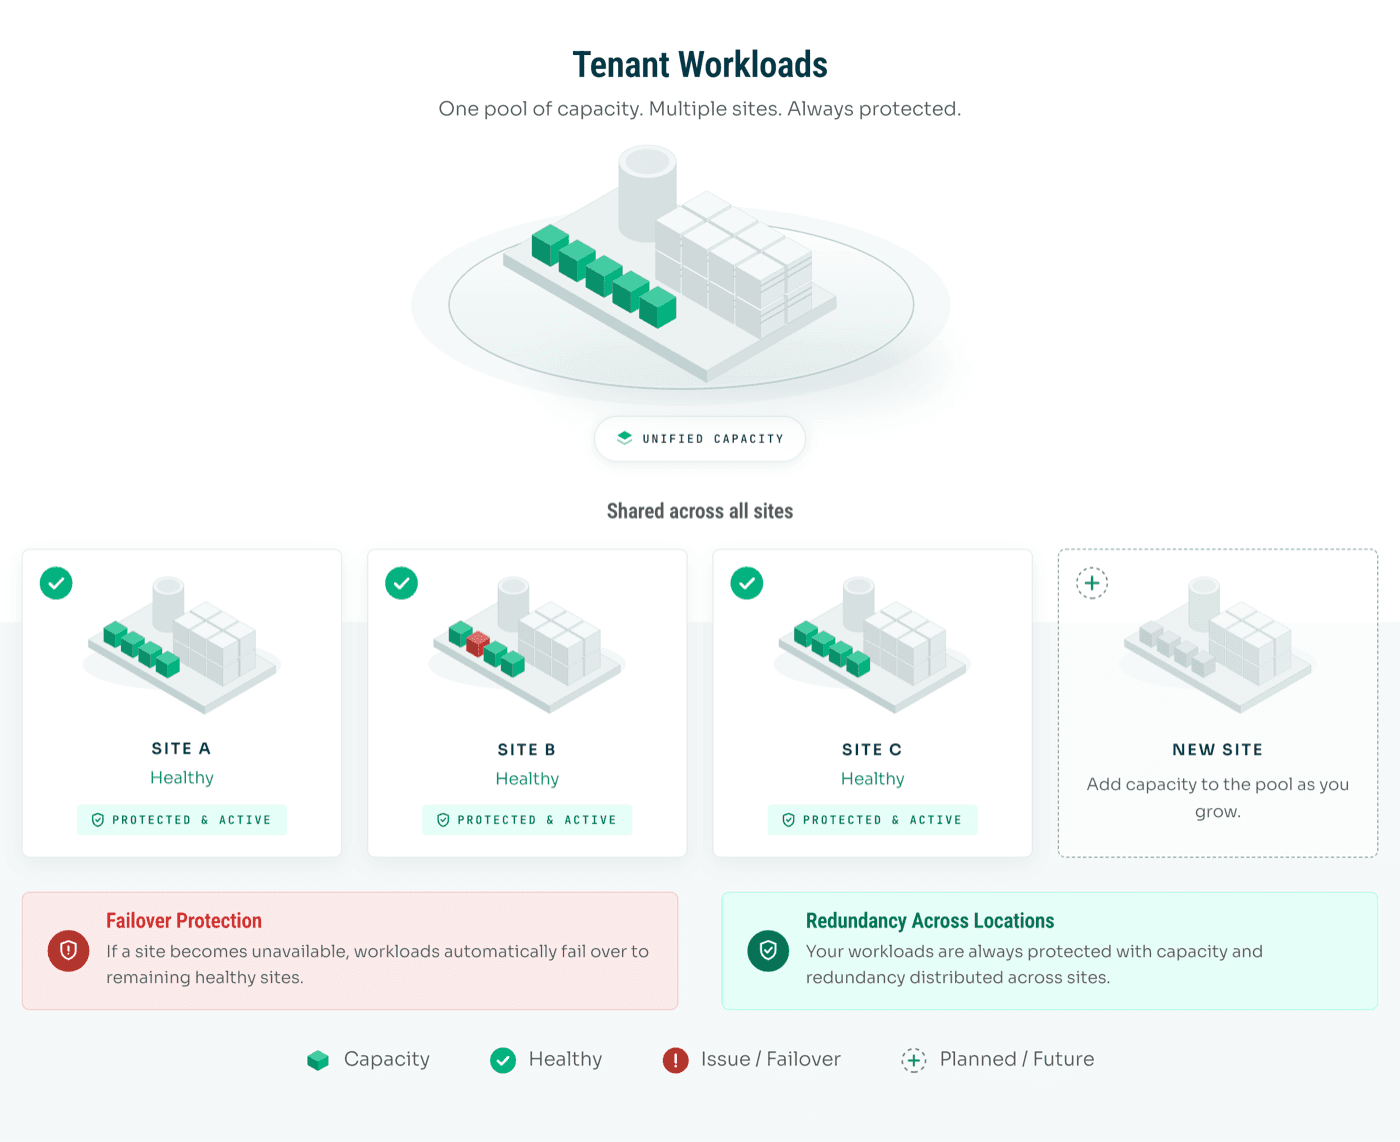
Cerbrec builds reliability into the network itself. Each tenant’s capacity is spread across several connected Tier I sites, and its applications run at each of them, so on the rare occasion that one site goes offline, the others carry on serving users. In effect, the network becomes the backup system that a Tier III building has to build into its own walls.
Moving the backup into the network also changes the economics of each site. A Tier III building invests in backup generators and duplicate power and cooling so that the building itself rarely goes down, since it has no other site to fall back on. A site with other sites around it already has much of that protection, so adding the same equipment everywhere would raise costs without giving the tenant much more. Tier I sites are less expensive to build and run, and once connected, they can keep the tenant’s service going through the occasional outage. The real test comes at the moment one site drops out.
What Happens When One Site Goes Offline
Picture four sites, each holding an equal share of the tenant’s capacity. If one goes offline, about three quarters of the capacity is still running, whereas a single building takes its capacity down with it. Whether that remaining capacity is sufficient depends on how much capacity the tenant needs at the time:
- A tenant using around half of its capacity still has room to spare on the remaining sites. Because those sites run the same applications, users carry on as normal.
- A tenant whose demand climbs above three quarters of its capacity needs more than the remaining sites can provide, and the network falls short until the site comes back online.
Notice that the outage is identical in both cases, with the same site down and the same quarter of the capacity gone. What differs is how much capacity the tenant needs at the time. Network sizing therefore comes down to two questions: how often a site might be offline, and the likelihood that demand could climb past the capacity left running.
Demand Determines How Much Spare Capacity Is Enough
AI demand rarely holds steady, and the way it moves shapes how an outage plays out:
- Enterprise applications may see relatively steady usage.
- Apps used directly by consumers may see much higher usage during the day than overnight.
- Product launches, or large numbers of AI agents sending requests at once, can push demand to roughly twice its usual level or more.
One measure that applies to all of these patterns is average utilization, the share of installed capacity a tenant actually uses over time. Keeping capacity fully used is hard, because capacity has to be big enough for a tenant’s busiest moments and stays partly idle for the rest of the day. Cerbrec modeled four illustrative patterns, from steady enterprise use to bursty agent traffic, each at an approximate average utilization of 30%. Across all four patterns, a network of four Tier I sites lost less service to site outages than a single Tier III building.
Where the patterns differed was in how much they gained from extra sites:
- Steady demand kept improving as sites were added, because each additional site reduces the share of capacity lost in a single outage, allowing more demand to be served.
- Bursty demand gained little beyond four sites, because most of the service it loses comes from bursts that go above all installed capacity, and adding more sites does little to cover those.
Bursts that large affect a Tier I network and a Tier III building alike, since they would cause a capacity shortfall even with every site running. Capacity planning handles them by keeping enough spare capacity to handle peak demand, and that same spare capacity ends up shaping how the sites are maintained.
Planning Repairs Around the Network
Spare capacity shows how much downtime the network can absorb, and with it, how urgently a site needs attention when something goes wrong. As long as the network can still meet the tenant’s availability target with one site offline, the repair can wait for a scheduled visit, which costs less than an emergency call-out and lowers operating costs. How long it can wait depends on the tenant’s demand pattern, the capacity at the other sites, and the availability target the network is built to meet.
For tenants, the result is dependable AI capacity that does not hinge on any one building. Cerbrec plans and orchestrates the network around each tenant’s requirements, so tenants get capacity spread across several sites without having to manage those sites themselves.
Readers who want to know more can read Cerbrec’s paper, Sizing Multi-Site Capacity with Loss-of-Load Probability.